Propre + Big Data* = 20/20 vision of the real estate market
If it sells quickly, did I sell too cheap? If it doesn't sell, is it just because it is too expensive? How to see this clearly? - propCHART can lift the fog.
Propre's propCHART provides visibility into the liquidity** of the real estate market.
The vertical axis shows movement of sales and leasing within two weeks, the horizontal axis shows the price/area unit and the time series is drawn as a vector. It displays the real movement in the specified region with the price transition based on the facts.
Analyze a 1km radius around the region you selected.
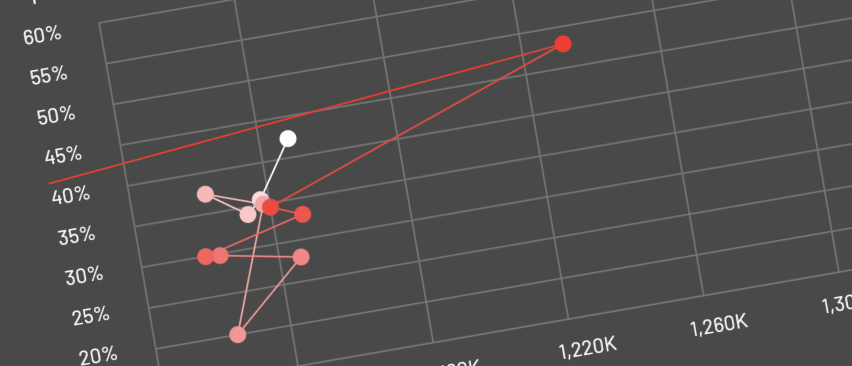
Changes in the liquidity and averaged price/area unit within a certain region around the specified location.
We use a proprietary algorithm based on publicly available real estate information to measure sales, rental prices/area unit and liquidity. You can see the demand a certain price/area unit represents.
Aggregate the real estate information published in the past within a certain radius from a specified point.
You can check the highest and lowest prices/area unit, the number of properties on public sale, the number of properties that have been on public sale for more than six months, the estimated gross yield, and the estimated price/area unit for a given location in a chronological order.
Creating a propCHART is free!
It can be used for a variety of purposes, such as analyzing the property under consideration for investment or as a reference for your home's asset value.
Start by simply entering your address and creating your chart.
Services you might find useful
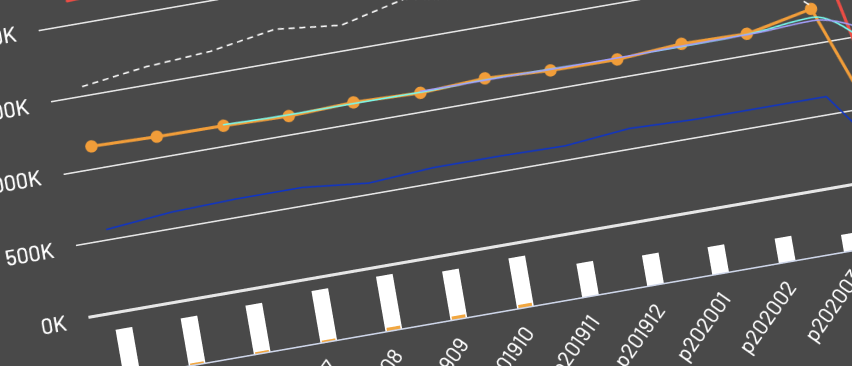
 propINDEX
An index listing of the (financial) potential of condominiums with month-by-month market trends, at a glance. In addition to station indices, you can see the overall trend of J-REITs, major train lines, and condominium brands.
Try now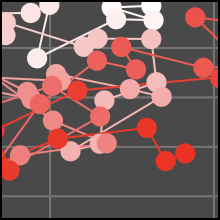 propCHART
Visualize the relation of price and liquidity in the real estate market with charts. This is a free service that shows the market trends of your region of interest from a variety of angles.
Try now World Dynamic Heat Map™
Dynamic Heat Map™ enables users to compare the property markets in 17 countries dynamically and simultaneously.
Try now